
The right metrics are crucial for marketers to gauge the effectiveness of their efforts. Understanding these metrics not only helps in making informed decisions but also allows businesses to optimize their strategies for better outcomes. Here are 15 essential metrics that every marketer should measure, ranging from website traffic and conversion rates to customer retention and ROI.
Table of Contents
1. Website Traffic
Website traffic refers to the number of visitors landing on your site. It’s a crucial metric because it gives you a sense of your online presence. The more visitors you attract, the higher the potential for conversions, whether it’s sales, sign-ups, or any other goal.
To measure website traffic, tools like Google Analytics are invaluable. They provide detailed insights into how many people visit your site, how long they stay, and what pages they view.
But it’s not just about the numbers; understanding where your traffic comes from is key. Traffic sources include direct (people typing your URL directly), referral (visitors from other websites), social (from social media platforms), and organic (from search engines).
Analyzing these sources helps you identify what’s working and what needs improvement. For instance, if your organic traffic is low, it might be time to invest in SEO. If social traffic is booming, consider boosting your social media efforts. Regularly reviewing this data allows you to fine-tune your strategies and drive even more visitors to your site.
2. Conversion Rate
Conversion rate is the percentage of visitors to your website who complete a desired action. It’s a key metric in marketing because it shows how effectively your site is turning visitors into customers or leads. A high conversion rate indicates that your marketing strategies are working well, while a low rate signals room for improvement.
Calculating your conversion rate is straightforward. Divide the number of conversions (like purchases or sign-ups) by the total number of visitors, then multiply by 100. For example, if you had 50 purchases from 1,000 visitors, your conversion rate would be 5%.
Conversion goals can vary based on your business objectives. Common goals include making a purchase, signing up for a newsletter, filling out a contact form, or downloading a resource. Each goal represents a step towards engaging your audience more deeply.
There are many ways to improve your conversion rate. Start by optimizing your website’s user experience. A/B testing different elements like headlines, images, and call-to-action buttons can reveal what resonates best with your audience. Personalize content to match visitor preferences and offer incentives like discounts.
3. Customer Acquisition Cost (CAC)
Customer acquisition cost (CAC) measures the total cost of acquiring a new customer. It’s a vital metric because it directly impacts your profitability. Understanding CAC helps you allocate your marketing budget effectively and identify which strategies are most cost-efficient.
Calculating CAC is simple: divide your total marketing and sales expenses by the number of new customers acquired during a specific period. For instance, if you spent $10,000 on marketing and gained 100 new customers, your CAC would be $100.
To reduce CAC, consider doing this. First, improve your targeting to reach the most relevant audience. Enhancing your website’s user experience can also lead to higher conversion rates, lowering the cost per acquisition.
Invest in content marketing and SEO to drive organic traffic. This often has a lower CAC compared to paid channels. Continuously optimizing your marketing efforts will help you acquire customers more cost-effectively.
4. Customer Lifetime Value (CLV)
Customer lifetime value (CLV) represents the total revenue you can expect from a customer over the entire duration of their relationship with your business. It helps you understand the long-term value of your customers and guides your marketing and retention strategies.
Calculating CLV involves a few steps. Start by determining the average purchase value, then multiply it by the average number of purchases per year. Finally, multiply by the average customer lifespan. For example, if a customer spends $100 per purchase, buys twice a year, and stays with you for five years, their CLV is $1,000.
CLV and customer acquisition cost (CAC) are closely related. Ideally, your CLV should be higher than your CAC to ensure profitability. If your CLV is significantly greater than your CAC, it means you’re getting a good return on your investment in acquiring new customers.
To increase CLV, focus on customer satisfaction and retention. Provide excellent customer service, offer loyalty programs, and regularly engage with customers through personalized marketing.
5. Return on Investment (ROI)
Return on investment (ROI) measures the profitability of your marketing efforts. It’s a key metric for marketers because it shows the financial return generated from your marketing spend.
Calculating marketing ROI is straightforward. Subtract the cost of the marketing campaign from the revenue generated by it, then divide by the cost of the campaign. Finally, multiply by 100 to get a percentage. For example, if a campaign generated $10,000 in revenue and cost $2,000, the ROI would be [(10,000 – 2,000) / 2,000] * 100 = 400%.
High-ROI campaigns often leverage cost-effective strategies and deliver significant returns. Examples include well-targeted email marketing campaigns, effective content marketing, and successful social media advertising that engages the right audience.
To maximize ROI, focus on understanding your audience and tailoring your campaigns to their needs and preferences. Use data-driven insights to refine your strategies continuously. A/B testing elements like ad copy can help identify what works best. Integrate multiple marketing channels to create a cohesive customer journey and increase the likelihood of conversions.
6. Bounce Rate
Bounce rate is the percentage of visitors who leave your website after viewing just one page. It’s an important metric because it indicates how engaging and relevant your content is to your audience. A high bounce rate can signal that your site isn’t meeting visitors’ expectations, which can hurt your conversion rates.

Measuring bounce rate is easy with tools like Google Analytics. It calculates the percentage of single-page sessions out of your total visits, giving you a clear picture of user engagement on your site.
High bounce rates can stem from various issues. Common reasons include slow page load times, poor mobile optimization, misleading meta descriptions, or content that doesn’t match user intent. Difficult navigation or intrusive pop-ups can drive visitors away.
To reduce your bounce rate, start by improving your site’s load speed. Ensure your website is mobile-friendly and easy to navigate. Craft clear, compelling meta descriptions that accurately reflect your content. Also, make sure your content is high-quality and relevant to your audience’s needs.
7. Engagement Rate
Engagement rate measures how actively your audience interacts with your content. It includes likes, comments, shares, and other actions that show user involvement. This metric is crucial because it indicates how well your content resonates with your audience and fosters a sense of community.
Different platforms have various ways to measure engagement. On social media, you can track likes, shares, comments, retweets, and reactions. For email marketing, engagement might be measured by open rates, click-through rates, and responses. Each platform offers tools and analytics to help you monitor these interactions.
Engagement is vital for building relationships with your audience. When people engage with your content, they’re more likely to remember your brand, trust your expertise, and become loyal customers. High engagement rates often lead to increased visibility, as algorithms tend to promote content that garners more interactions.
To boost engagement rates, create content that’s relevant and valuable to your audience. Ask questions, encourage discussions, and respond promptly to comments. Use eye-catching visuals and compelling headlines to draw attention.
8. Social Media Reach
Social media reach is the number of unique users who see your content. It’s a key metric for understanding the scope of your brand’s visibility on social platforms. A broad reach means your message is getting in front of more potential customers, which can drive awareness and engagement.
To measure reach, use tools like Facebook Insights, Twitter Analytics, and Instagram Insights. These platforms provide data on how many unique users have seen your posts. You can also use third-party tools like Hootsuite and Sprout Social for comprehensive analytics across multiple platforms.
It’s important to distinguish between reach and impressions. While reach counts the unique viewers, impressions measure the total number of times your content is displayed, including multiple views by the same user. High impressions with a low reach might indicate your content is seen repeatedly by the same audience.
To increase your social media reach, create shareable content that resonates with your audience. Use relevant hashtags to expand your visibility. Engage with your followers by responding to comments and messages promptly. Collaborate with influencers to tap into their audiences.
9. Email Open Rate
Email open rate is the percentage of recipients who open your email out of the total number sent. It’s a vital metric because it shows how effectively your subject lines and sender names attract attention, which is the first step in engaging your audience through email marketing.
To track and measure email open rates, use email marketing tools like Mailchimp, Constant Contact, or HubSpot. These platforms provide detailed analytics on how many people opened your emails, along with other useful metrics.

Several factors influence open rates. Subject lines are crucial; they need to be compelling and relevant to entice recipients to open the email. Timing also plays a significant role; send emails when your audience is most likely to check their inboxes to improve open rates.
To improve your email open rates, start by crafting intriguing and clear subject lines that spark curiosity or provide value. Test different send times to see when your audience is most responsive. Segment your email list to send more targeted and relevant content.
10. Click-Through Rate (CTR)
Click-through rate (CTR) measures the percentage of people who click on a link, button, or image in your content out of the total number of users who view it. It’s crucial because it indicates how compelling your content or offer is in driving actions from your audience.
You can measure CTR across different channels, such as email campaigns and PPC ads. Email CTR shows how well your email content resonates with subscribers. PPC CTR measures the effectiveness of your ad copy and targeting. Social media CTR indicates how engaging your posts are in prompting users to click through to your website or landing page.
Effective CTAs play a significant role in improving CTR. Examples include clear and action-oriented phrases like ‘Shop Now’, ‘Learn More’, or ‘Sign Up Today’. A good CTA should be visible, compelling, and relevant to the content surrounding it.
To enhance CTR, optimize your CTAs by testing different formats, colors, and placements. Use compelling visuals and concise, persuasive language. Tailor your messaging to match the audience’s interests and needs.
11. Lead Generation
Lead generation is the process of attracting and converting prospects into potential customers. It involves various metrics to measure the effectiveness of your efforts, such as the number of leads generated, conversion rates, and cost per lead. These metrics help you gauge the success of your campaigns and optimize your strategies.
Tracking leads from different sources is crucial to understanding which channels are most effective. You can track leads from sources like social media, email campaigns, content marketing, and paid advertising. By analyzing data from each source, you can allocate resources to the most profitable channels.
To optimize lead generation strategies, focus on creating valuable and relevant content that addresses your audience’s pain points. Use lead magnets like ebooks, webinars, or free trials to capture contact information. Implement effective lead nurturing campaigns to build relationships and guide leads through the sales funnel.
12. Customer Retention Rate
Customer retention rate measures the percentage of customers that a business retains over a specific period. It’s crucial because retaining existing customers is more cost-effective than acquiring new ones and indicates customer satisfaction and loyalty.
Calculating retention rate is straightforward: divide the number of customers at the end of a period by the number at the start, then multiply by 100. Tracking retention rate over time helps businesses understand trends in customer loyalty and satisfaction.
Successful retention campaigns often involve targeted messaging that addresses customer needs and preferences. For instance, personalized emails offering exclusive discounts to repeat customers can incentivize further purchases.
Loyalty programs with rewards for frequent purchases or referrals also encourage retention. Companies that consistently provide value and maintain strong relationships with their customer base tend to see higher retention rates.
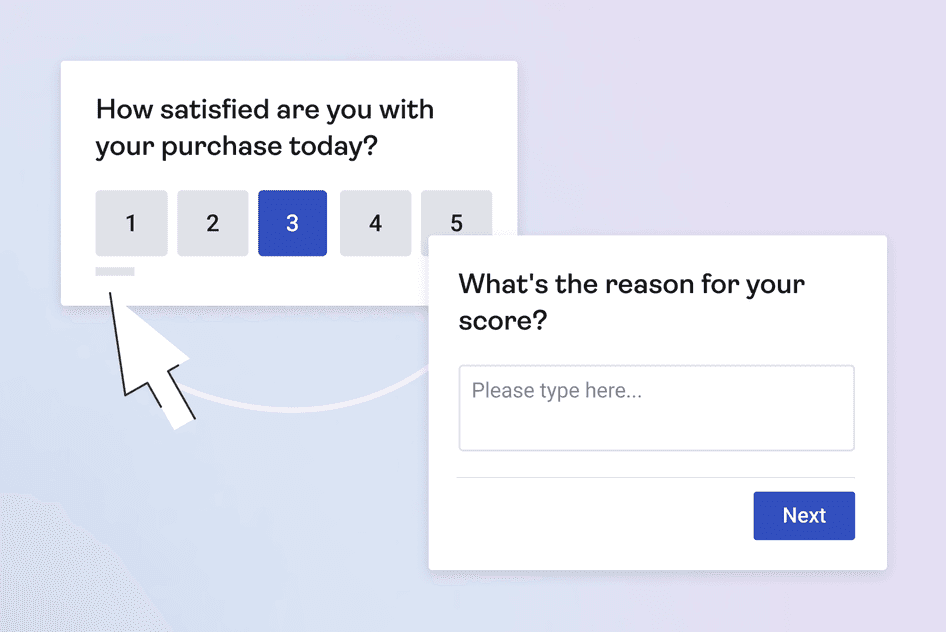
13. Net Promoter Score (NPS)
Net promoter score (NPS) is a metric used to measure customer loyalty and satisfaction based on the likelihood of customers recommending your business to others. It’s significant because it provides a clear indicator of overall customer sentiment and helps businesses understand their reputation and potential for growth.

To measure NPS, businesses typically ask customers a single question: On a scale of 0 to 10, how likely are you to recommend us? Based on their responses, customers are categorized into Promoters (score 9-10), Passives (score 7-8), and Detractors (score 0-6).
Analyzing NPS feedback involves calculating the percentage of promoters minus the percentage of detractors to arrive at the NPS score. This score can guide strategic decisions and initiatives aimed at improving customer satisfaction and loyalty.
Successful companies use NPS feedback to implement changes that positively impact customer experience. For example, after analyzing NPS data indicating issues with customer support, a company might revamp its training programs to enhance service quality.
14. Sales Revenue
Sales revenue is the total income generated from selling products or services. It directly reflects the effectiveness of marketing strategies in driving sales and revenue growth.
Tracking sales revenue from marketing campaigns involves attributing revenue to specific marketing activities. This can be done through tools like Google Analytics, CRM systems, or marketing automation platforms. By tracking conversions and sales, marketers can identify which campaigns or channels contribute the most to revenue generation.
Maximize revenue through targeted campaigns. Personalize offers, segment audiences, and use data-driven insights to tailor messaging. This will increase conversion rates and average order values. By continuously analyzing performance metrics and adjusting strategies accordingly, marketers can optimize sales revenue and drive sustainable business growth.
15. MQLs to SQLs Conversion Rate
Marketing qualified leads (MQLs) are prospects identified by marketing as having potential interest in a company’s products or services. Sales qualified leads (SQLs) are MQLs that sales teams have qualified as likely to make a purchase based on specific criteria.
Measuring the conversion rate between MQLs and SQLs involves calculating the percentage of MQLs that progress to become SQLs. This metric helps gauge the effectiveness of marketing efforts in delivering qualified leads to the sales team.
To improve MQL to SQL conversion rates, marketers should focus on lead nurturing and qualification processes. Providing relevant content that addresses buyer pain points and challenges can nurture MQLs through the sales funnel. Implement lead scoring models based on engagement levels and behavior.
Drive Your Growth
Regularly monitor and analyze metrics such as conversion rates, customer acquisition costs, and engagement levels. This way, businesses can adapt quickly to market trends and customer preferences. Emphasizing these metrics not only enhances decision-making but also fosters stronger customer relationships and maximizes returns on marketing investments.
Ready to elevate your digital marketing strategy? Explore how EvolveDash can boost your metrics!
FAQs
1. What is the difference between impressions and reach?
Reach counts the number of unique people who see your content, while impressions track the total number of times it appears, including repeat views.
2. How can I improve my email click-through rate (CTR)?
To increase CTR, use compelling subject lines, personalize emails, add clear call-to-actions (CTAs), and A/B test different formats to see what works best.
3. Why is customer retention rate important?
It costs less to retain an existing customer than to acquire a new one. A high retention rate shows customer satisfaction and long-term business stability.
4. What’s the best way to track marketing ROI?
Use analytics tools like Google Analytics, CRM software, or UTM parameters to measure conversions and link them to specific marketing efforts.
5. How does engagement rate impact social media performance?
Higher engagement signals that your content is relevant and valuable, leading to better visibility in social media algorithms and increased brand awareness.